

Most showroom layout decisions get made on a Tuesday afternoon because someone walked in, looked at the engagement ring case, and said "this feels crowded." Two salespeople nod, a tech shifts some trays, and by Friday nobody remembers what changed or whether it did anything.
That's the real problem with jewelry showroom layouts. It's not that owners lack taste or instinct. It's that nobody runs the change as a measurable test, so you end up with a store full of decisions that felt right but were never actually checked against conversion or average order value. When you're moving pieces that carry four and five figure price tags, "it feels better" is an expensive way to make decisions.
A proper showroom A/B test for jewelry fixes that. You change one thing, measure a real outcome, and keep what works. The catch is that most A/B testing advice online is written for websites with 50,000 visitors a month. A jewelry store sees a tiny fraction of that traffic, and the stakes per customer are enormous. So the whole approach has to be rebuilt for small-store reality.
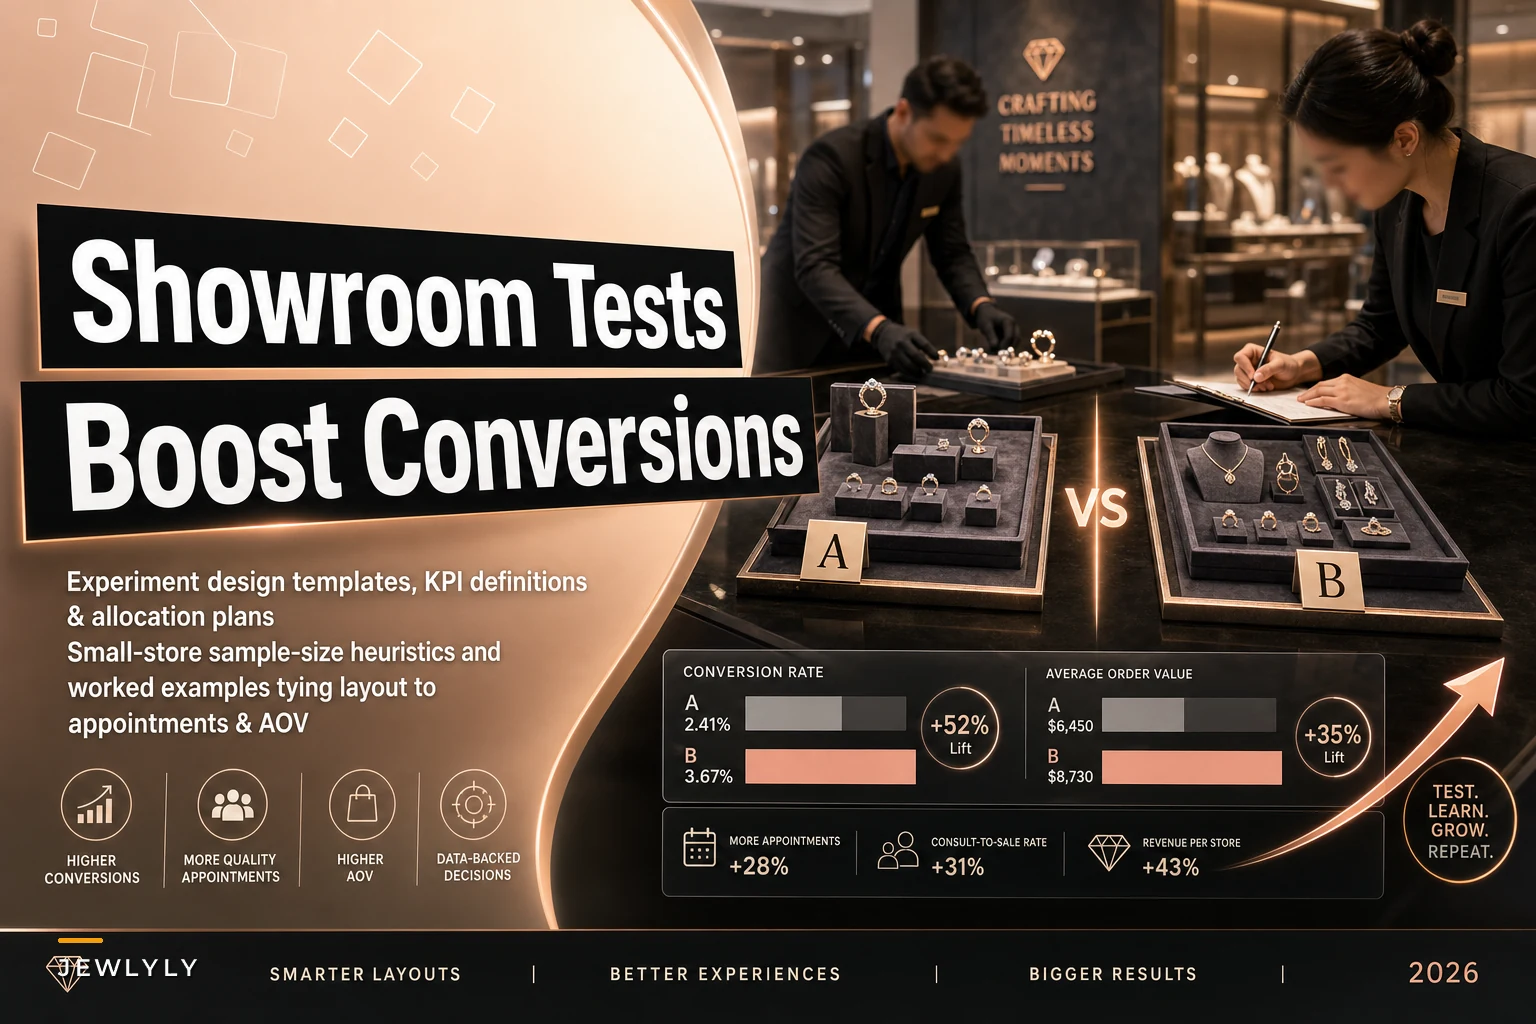
This piece walks through how to actually set those tests up — the templates, the KPIs, the sample-size math that works at low traffic, and worked examples tying a display change to appointment conversions and AOV.
Why most showroom "tests" aren't tests
There's a pattern that shows up constantly. A store rearranges the bridal case, sales go up the next month, and everyone concludes the new layout works. Then you look closer and notice that month contained a bridal show, a payday weekend, and a vendor trunk event. The layout might have done nothing. Or it might have done a lot. You genuinely cannot tell, because three things changed at once and there was no control.
A real experiment isolates the variable. You're not asking "did sales go up?" You're asking "did this specific change cause a measurable lift, holding everything else roughly constant?" That distinction is the entire game.
The second common failure is measuring the wrong thing. Owners default to total revenue because that's the number on the P&L. But revenue is noisy and lagging. A single $18k custom piece can swamp an entire week of foot traffic and completely mask whether your new case layout is actually converting browsers into buyers. You need cleaner, earlier signals — which is what the KPI section below is about.
You should design tests that isolate a single change and pick a KPI that responds quickly to that change.
The KPIs that actually matter for layout tests
For showroom experiments you want metrics that respond quickly to the change and aren't dominated by one-off whale sales. Here's how I'd rank them.
Never miss a sale or shipment again.
Jewlyly helps you manage orders, track inventory, and engage customers seamlessly.
- Real-time inventory tracking
- Automated customer notifications
- Sales and order analytics
No credit card required
| KPI | What it measures | Why it works for layout tests | Watch out for |
|---|---|---|---|
| Case engagement rate | % of visitors who stop and look at a target case | Directly reflects whether the layout draws attention | Needs staff or a counter to log it |
| Appointment conversion | % of walk-ins who book a consult | Strong leading indicator for high-ticket | Seasonality (bridal season skews it) |
| Try-on rate | % of engaged visitors who handle a piece | Handling strongly predicts purchase | Staff-dependent to record |
| AOV for the target category | Average ticket for the tested case | Catches "same conversions, bigger baskets" | One large custom order distorts it |
| Attach rate | Items per transaction near the test zone | Reveals whether layout drives add-ons | Slow to accumulate at low traffic |
Record AOV at the category level rather than store-wide to avoid whale-order distortion.
The two I lean on hardest for layout work are appointment conversion and category AOV. Conversion tells you whether the layout moves people toward a high-intent next step, and AOV tells you whether it changes what they buy. A layout that lifts conversion but drops AOV might just be pulling people toward cheaper pieces — which you'd never catch if you only looked at booking counts.
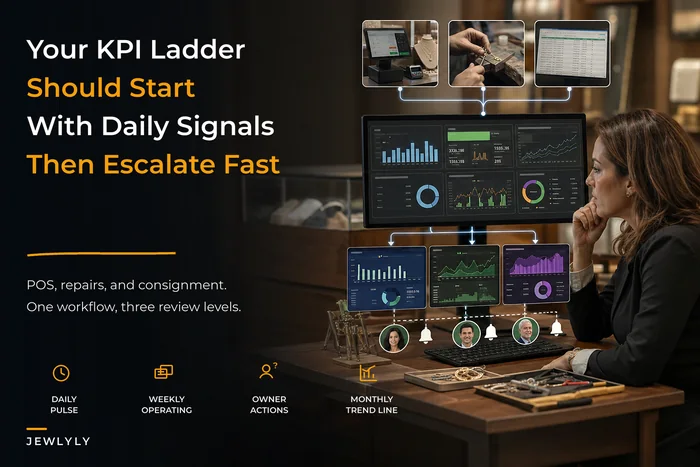
If you already track these in a structured dashboard, you're ahead of most. If not, building out a tiered KPI view that pulls POS, repair, and consignment metrics together makes this kind of testing dramatically easier, because the baseline numbers are already sitting there instead of living in someone's head.
The small-store sample-size problem
The uncomfortable truth: a store doing 30–60 walk-ins a day will never get the clean statistical significance that web A/B testing tools promise. You don't have the volume. So you need heuristics built for small numbers, not textbook formulas that demand thousands of observations.
-
Minimum 100 observations per variation before you even glance at results. Below that, the noise is bigger than almost any effect you'll see.
-
Expect to run tests for 3–6 weeks, not 3–6 days. You need to average across weekday/weekend and payday cycles.
-
Only trust effects that are large. At small-store volume you can reliably detect a jump from, say, 8% to 14% conversion. You cannot reliably detect 8% to 9%. If the effect is small, you won't see it clearly, and chasing it isn't worth the operational churn.
-
Count whole weeks. Always run tests in complete 7-day blocks so you don't accidentally overweight a strong Saturday.
A rough heuristic worth following: if your target case gets about 150–200 engaged visitors a month, plan on a 6-week test to gather enough on each side of a comparison. If it gets closer to 400+, you can tighten to around 3–4 weeks. Below roughly 100 engaged visitors a month, don't bother with formal A/B — just do sequential before/after testing and accept it's directional, not conclusive.
Two allocation plans, and when to use each
You have two realistic ways to run these at a physical store.
1. Sequential (A then B). Run layout A for three weeks, switch to layout B for three weeks, compare. Simple, cheap, no spatial conflict. The weakness is time confounding — if a holiday or metal-price spike lands in week five, it contaminates the B period.
2. Simultaneous split. If you have two similar cases, two entrances, or ideally two locations, you run A and B at the same time and compare. This controls for time beautifully but introduces location bias — your mall store and your downtown store simply aren't the same audience.
| Approach | Best for | Main risk | Mitigation |
|---|---|---|---|
| Sequential | Single-location stores | Time/seasonal confounding | Run in matched weeks, avoid holiday periods |
| Simultaneous (two cases) | Stores with duplicate displays | Position bias | Swap positions halfway through |
| Simultaneous (two stores) | Multi-location groups | Audience differences | Normalize by each store's baseline rate |
For most independent jewelers, sequential is the realistic default. The key discipline is picking two comparable time windows and staying away from major shopping events so the periods are genuinely apples-to-apples.
A worked example: moving the bridal case
A single-location store had its engagement ring case tucked against the back wall, past the watch counter. Walk-ins had to navigate around a repair drop-off station to reach it. Staff suspected traffic was dying before it got there.
The test: move the bridal case to the front-right, in direct sightline of the entrance, for a 5-week sequential comparison against the prior 5-week baseline.
Baseline period (back wall):
-
Roughly 310 walk-ins
-
About 58 engaged with the bridal case (~19% engagement)
-
11 appointments booked from that case
-
Bridal category AOV around $2,400
Test period (front-right):
-
Roughly 330 walk-ins (comparable traffic)
-
About 97 engaged (~29% engagement)
-
21 appointments booked
-
Bridal category AOV around $2,650
The engagement rate jump — 19% to 29% — is large enough to trust at this volume. Appointment bookings nearly doubled off a higher engaged base. AOV ticked up modestly, probably because customers were reaching the case fresh rather than already halfway out the door.
What makes this a valid test rather than a lucky month: traffic was comparable, no trunk show or major holiday fell in either window, and only the case position changed. The repair station stayed put. Staffing stayed put. One variable moved.
The follow-through matters too. Those 21 appointments only pay off if the consult process converts them, which is where a tight pre-appointment capture and in-room demo sequence does the heavy lifting. A layout that generates bookings you then fumble in the room is just moving the bottleneck.
The experiment design template
Here's the one-page structure I'd use for every showroom test. Fill it out before you move anything.
-
Hypothesis — one sentence. "Moving the bridal case to the front entrance will increase appointment conversion from that case."
-
Single variable — name exactly what changes. Nothing else moves.
-
Target KPI — your primary metric (e.g., appointment conversion). Pick one.
-
Secondary KPIs — 2–3 supporting metrics (engagement rate, category AOV).
-
Measurement method — how it's logged. Staff tally, POS category report, counter.
-
Allocation — sequential or simultaneous, and why.
-
Duration & blocks — number of complete weeks per variation.
-
Minimum observations — the threshold before you read results.
-
Exclusions — holidays, trunk shows, promotions to avoid or flag.
-
Decision rule — what result keeps the change, reverts it, or triggers a re-test.
That last line is the one people skip and regret. Decide in advance what counts as a win. "A 5-point lift in conversion keeps the layout" is a decision rule. "Let's see how it feels" is not.
A simple logging workflow that actually gets done
The reason showroom tests collapse isn't analysis — it's data capture. Staff are selling, not clipboard-watching. So the logging has to be nearly frictionless or it won't happen.
Here's a workflow that holds up in practice. The opening associate notes the test variation on the day sheet. When a customer engages the target case, whoever's closest makes a single tick on a tally card at the register — no name, no detail, just a mark. Appointments and sales get tagged in the POS with the test category code they're already using. At close, the manager transfers three numbers — walk-ins, engagements, bookings — into a running sheet. That's it. Thirty seconds a day.
Quick diagram to share with staff so everyone follows the same logging steps.
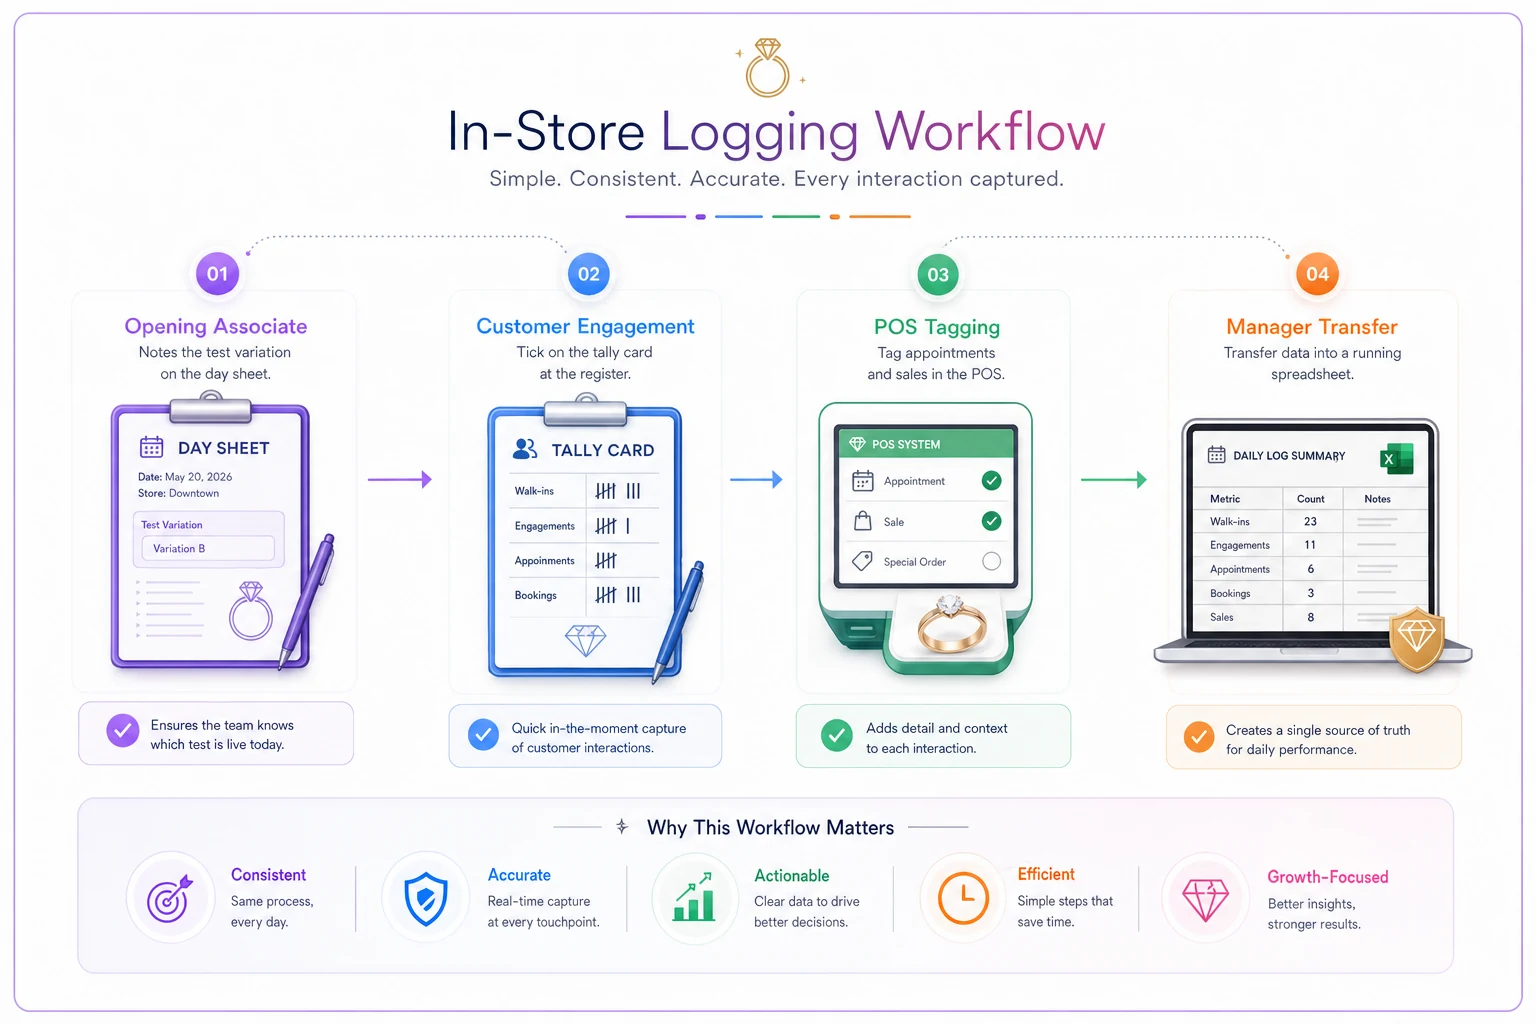
The mistake is trying to capture ten fields per visitor. Nobody sustains that past week one. Capture the three numbers that drive your decision and let everything else go.
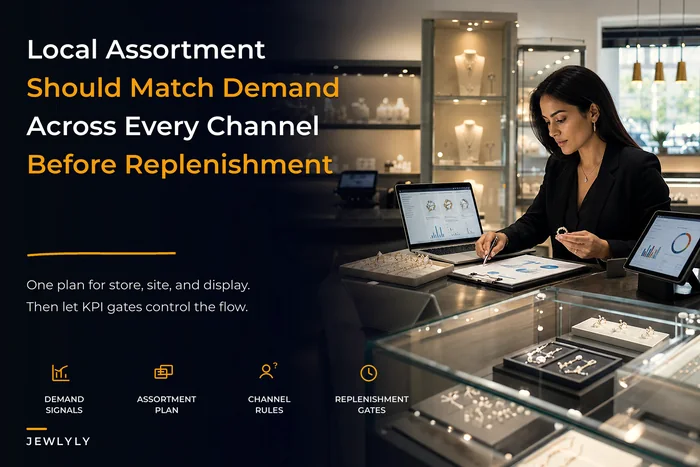
If you're already structuring merchandising decisions around how local displays line up with your catalog and assortment, feeding test results back into that system keeps the whole thing coherent — this connects directly to aligning local assortment, online catalog, and displays rather than treating layout as a one-off cosmetic tweak.
When this makes sense — and when it doesn't
This makes sense when:
-
You have a specific, recurring layout question worth real money (bridal placement, high-ticket case visibility, entry flow).
-
Your target case gets at least ~100 engaged visitors a month.
-
You can commit to leaving it alone for the full test window.
This is a bad idea when:
-
You're in peak season. December traffic and emotion will distort everything.
-
You want to change five things at once. Then you learn nothing.
-
Your volume is so low that even a 6-week run won't clear 100 observations per side. At that point, run sequential before/after as directional insight and accept the limits.
Who should NOT run formal tests: brand-new stores with no stable baseline, and stores mid-renovation where the whole environment is in flux. Get a steady baseline first; you can't measure a change against nothing.
Real scenario: a two-case watch test
A store with two near-identical watch cases flanking the center aisle wanted to know whether angling pieces toward the entrance beat the flat tray presentation they'd always used.
They ran a simultaneous split for four weeks, then swapped the cases' presentations at the halfway mark to cancel out position bias. Angled case engagement ran noticeably higher throughout — somewhere around a third more stops than the flat case, consistent before and after the swap. Try-on rate followed. Watch AOV moved only slightly, but attach rate on straps and bands crept up, which added a few hundred dollars across the month.
The outcome wasn't dramatic revenue fireworks. It was a durable, repeatable 30-ish percent lift in engagement that held up when they swapped positions — which is exactly what separates a real effect from a fluke. They rolled angled presentation to every case and stopped guessing.
The mistake that undoes good tests
Even stores that run clean experiments often sabotage them at the end: they change the layout, confirm it worked, and then keep fiddling. New season, new feeling, trays shift again, and the hard-won result evaporates because nobody documented the winning configuration.
Treat a validated layout like a validated recipe. Photograph it, note the exact case positions, and make it the standard until a new test beats it. The whole point of testing is to stop relying on whoever's instinct won the argument that week. If you prove something works, lock it in and make the next test prove something new.
That's the quiet discipline behind showroom experiments. Not fancy statistics — just isolating one variable, measuring an honest KPI long enough to trust it, and actually keeping what wins. Do that a handful of times a year on your highest-ticket cases, and you stop decorating your showroom and start engineering it.
That's the quiet discipline behind showroom experiments. Not fancy statistics — just isolating one variable, measuring an honest KPI long enough to trust it, and actually keeping what wins. Do that a handful of times a year on your highest-ticket cases, and you stop decorating your showroom and start engineering it.
Ready to elevate your jewelry store operations?
Join 500+ jewelers using Jewlyly to increase efficiency, reduce errors, and grow revenue.