



Most jewelry stores already sit on more data than they realize. Every repair ticket, every appointment no-show, every memo pulled from a vendor, every ring sized and held — it's all getting captured somewhere. The problem isn't a lack of data. It's that the data lives in six places, nobody fully trusts it, and when you finally pull a report it's either stale or quietly contradicts another report.
That's the gap a jewelry data maturity roadmap closes. Not by buying a fancier dashboard, but by sequencing the work so each stage actually earns the next one. You can't do useful machine learning on dirty inventory records. You can't forecast if your SKU attributes are inconsistent. And you can't trust a "customer propensity score" if half your appointments never got tied back to a sale.
What follows is the staged path we've watched work across stores ranging from single showrooms to small multi-location groups. Each stage has its own KPIs, its own staffing reality, and its own failure modes. The mistake almost everyone makes is trying to jump two stages ahead — buying predictive tooling while their data hygiene is still a mess.
You can't do useful machine learning on dirty inventory records. You can't forecast if your SKU attributes are inconsistent. And you can't trust a "customer propensity score" if half your appointments never got tied back to a sale.
The three stages, and why the order is non-negotiable
Think of this less like a ladder and more like pouring a foundation before framing a house. Skip a stage and the thing above it cracks.
| Stage | What it actually does | Primary outcome | Typical duration |
|---|---|---|---|
| 1. Hygiene + Enrichment | Clean records, consistent attributes, single source of truth | Trustworthy data, faster reorders | 3–6 months |
| 2. Analytics | Turns, AOV, LTV, cohort views, assortment analysis | Decisions backed by numbers, not gut | 2–4 months (overlaps Stage 1) |
| 3. ML Pilots | Predictive reorder, appointment-to-sale propensity | Automated forecasting, prioritized selling | Ongoing, narrow pilots first |
The reason the order matters: a predictive reorder model trained on inconsistent category tags will confidently recommend reordering the wrong things. Garbage in isn't just garbage out — it's confident garbage out, which is worse because people act on it.
Most stores are somewhere between Stage 1 and 2 and think they're ready for Stage 3. They're usually not. The good news is Stage 1 and 2 deliver real money on their own, so you're not waiting until the end to see returns.
Stage 1: Hygiene and enrichment (the unglamorous money-maker)
This is the stage everyone wants to skip and nobody should. It's boring. It's also where the biggest hidden losses are.
Never miss a sale or shipment again.
Jewlyly helps you manage orders, track inventory, and engage customers seamlessly.
- Real-time inventory tracking
- Automated customer notifications
- Sales and order analytics
No credit card required
Hygiene is about correctness: the same ring isn't entered three different ways, your metal weights are populated, your vendor SKUs map cleanly to your internal SKUs, and your POS categories don't have both "Bridal" and "Engagement" fighting over the same inventory. Enrichment is about completeness — adding the structured attributes (center stone shape, metal karat, setting type, carat range) that later stages depend on.
A typical example of what broken hygiene actually costs: a store with roughly 4,000 active SKUs finds that 12–15% have missing or inconsistent category data. When they run a reorder report, those items are invisible. So they quietly stock out on steady sellers while over-ordering slow categories, and the owner has no idea because the report looks complete.
What good looks like in Stage 1
-
Every active SKU has a complete, validated attribute set (no blanks in required fields)
-
One canonical record per physical item — no duplicates across channels
-
Vendor-to-internal SKU mapping is documented and maintained
-
Memo, consignment, and owned inventory are clearly flagged and never blur together
-
Appointments, repairs, and sales all carry a customer ID that ties back to one profile
That last point is where most of the long-term value lives. If your appointment system and your POS don't share a customer identity, you can never measure whether appointments actually turn into sales — which means you're flying blind on your single most expensive sales activity.
This is also why a real single source of truth data architecture isn't a Stage 3 luxury — it's what makes Stage 3 possible at all. The SSOT is the spine. Everything predictive you build later is just reading off it.
KPIs worth tracking in Stage 1
-
Record completeness rate — % of active SKUs with all required attributes filled (target: 95%+)
-
Duplicate rate — duplicate records per 1,000 SKUs (target
under 5)
-
Customer identity match rate — % of transactions tied to a known customer profile (target: 80%+ for appointment-driven sales)
-
Reorder report coverage — % of inventory actually visible to your reorder logic
Staffing and cost heuristics
You don't need a data scientist here. You need one detail-obsessed person and clear rules. For a store under roughly 5,000 SKUs, budget somewhere around 60–100 hours of focused cleanup to get from messy to clean, then a few hours a week of maintenance. Multi-location groups should assign a single data owner per location who reports to one standards person — otherwise each store invents its own tagging dialect and you're back to chaos within a quarter.
Start by enforcing cleanliness on the fields your reorder and propensity models will use first (category, vendor lead times, and customer ID).
When this makes sense: always. There is no store too small for clean data. Who should not skip ahead: anyone whose last physical count disagreed with their system by more than a few percent. Fix that first.
Stage 2: Analytics (making the clean data earn its keep)
Once data is trustworthy, analytics stops being an argument. This is where you shift from "I think bridal is selling well" to "bridal turns 3.2x a year, fashion gold turns 1.4x, and we're holding six figures in dead stock in the second category."
The three numbers that matter most for jewelry, and how they connect:
-
Inventory turns — how fast you sell through and replace stock. Low turns tie up cash and age your assortment.
-
AOV (average order value) — tells you whether your selling and merchandising are lifting ticket size.
-
LTV (customer lifetime value) — the long game. Repairs, aftercare, upgrades, and repeat purchases over years.
These aren't separate dashboards. They're a system. Turns tell you what to stock. AOV tells you how you're selling it. LTV tells you who is worth chasing. A store optimizing turns alone will gut its high-margin, slow-moving pieces that actually drive LTV through custom and bridal relationships.
A worked example
A single-location store runs a cohort analysis once their customer identity is clean. They find that customers who came in through an appointment had an AOV roughly 2.5x their walk-in AOV, and were about three times as likely to return within 18 months. That one finding reshaped their entire staffing model — they started protecting appointment slots and measuring appointment-to-sale conversion as a real KPI instead of an afterthought.
Before the analysis they couldn't have told you any of that, because appointments and sales lived in separate systems with no shared key. Stage 1 made Stage 2 possible.
Analytics KPIs and the escalation logic
-
Turns by category (watch for anything under roughly 1.5x annually — that's aging capital)
-
AOV by channel and by associate
-
Appointment-to-sale conversion rate
-
Repeat purchase rate at 12 and 24 months
-
Dead stock % (items with zero movement in 180+ days)
Most stores look at store-wide averages and miss the variance underneath. Store-wide turns of 2.0x can hide one category at 4x and another at 0.6x. Averages comfort you. Segmentation tells you where the money is stuck.
Staffing and cost
Stage 2 is mostly tooling plus a few hours a week of someone who can read the numbers and ask good questions. This is also where seasonal demand forecasting with reorder automation starts delivering — because your forecasts are now built on clean, segmented data instead of a gut feel about "last Christmas."
When analytics is a bad idea: if you're still arguing about whether the numbers are right. That means you're not done with Stage 1. Running analytics on data you don't trust just gives everyone a new reason to ignore the data entirely.
Stage 3: ML pilots (narrow, measurable, boring on purpose)
The best machine learning pilots in a jewelry store are deliberately small and unexciting. You're not building a crystal ball. You're automating one decision that's currently being made by overworked humans with incomplete information.
Two pilots consistently earn their keep first.
Pilot A: Predictive reorder
Sample pilot template:
-
Scope narrowly. Pick one or two high-velocity categories (e.g., diamond studs, classic wedding bands). Don't try to do everything at once.
-
Define the baseline. Measure current stockout days and current overstock capital for those categories over the last 12 months.
-
Set the success metric. Reduce stockout days by X% without increasing overstock capital.
-
Run in shadow mode first. Let the model make recommendations for 4–6 weeks while a human still places the real orders. Compare what it would have done vs. what you actually did.
-
Graduate to assisted mode. The model recommends, a human approves with one click.
-
Review weekly. Track hit rate and adjust.
The shadow-mode step is what separates pilots that stick from pilots that get abandoned. It builds trust before you hand over any real control.
Pilot B: Appointment-to-sale propensity
Sample pilot template:
-
Pull 12–24 months of appointment outcomes (converted / didn't, ticket size).
-
Identify the features that actually predict conversion (prior purchase history, referral source, items pre-shared, response speed to booking).
-
Build a simple scoring model — start with something interpretable, not a black box.
-
Validate against a holdout period before trusting it live.
-
Use the score to drive prep, not to screen anyone out. The goal is better preparation for high-intent visits, not filtering customers.
The failure mode to avoid: treating a propensity score as a verdict. A low score doesn't mean don't try — it means the story isn't captured in your data yet. These models prioritize attention; they don't replace judgment.
ML pilot KPIs
-
Stockout days reduced (predictive reorder)
-
Overstock capital held flat or reduced (predictive reorder)
-
Forecast accuracy / recommendation hit rate
-
Conversion lift on high-score appointments (propensity)
-
AOV lift on prepared appointments
Staffing and cost reality
You probably don't need to hire a data science team. Most small and mid-size jewelers get here through operational software that bakes these models in, with one internal owner who understands the business context well enough to sanity-check outputs. The expensive mistake is hiring a specialist before you've proven a pilot works — you end up paying for horsepower you can't yet use.
Who should not start ML pilots yet: anyone whose Stage 2 analytics aren't being used in weekly decisions. If nobody's acting on your turns and AOV reports, a predictive model won't change behavior. It'll just be a smarter report nobody reads.
How the stages connect into one operating system
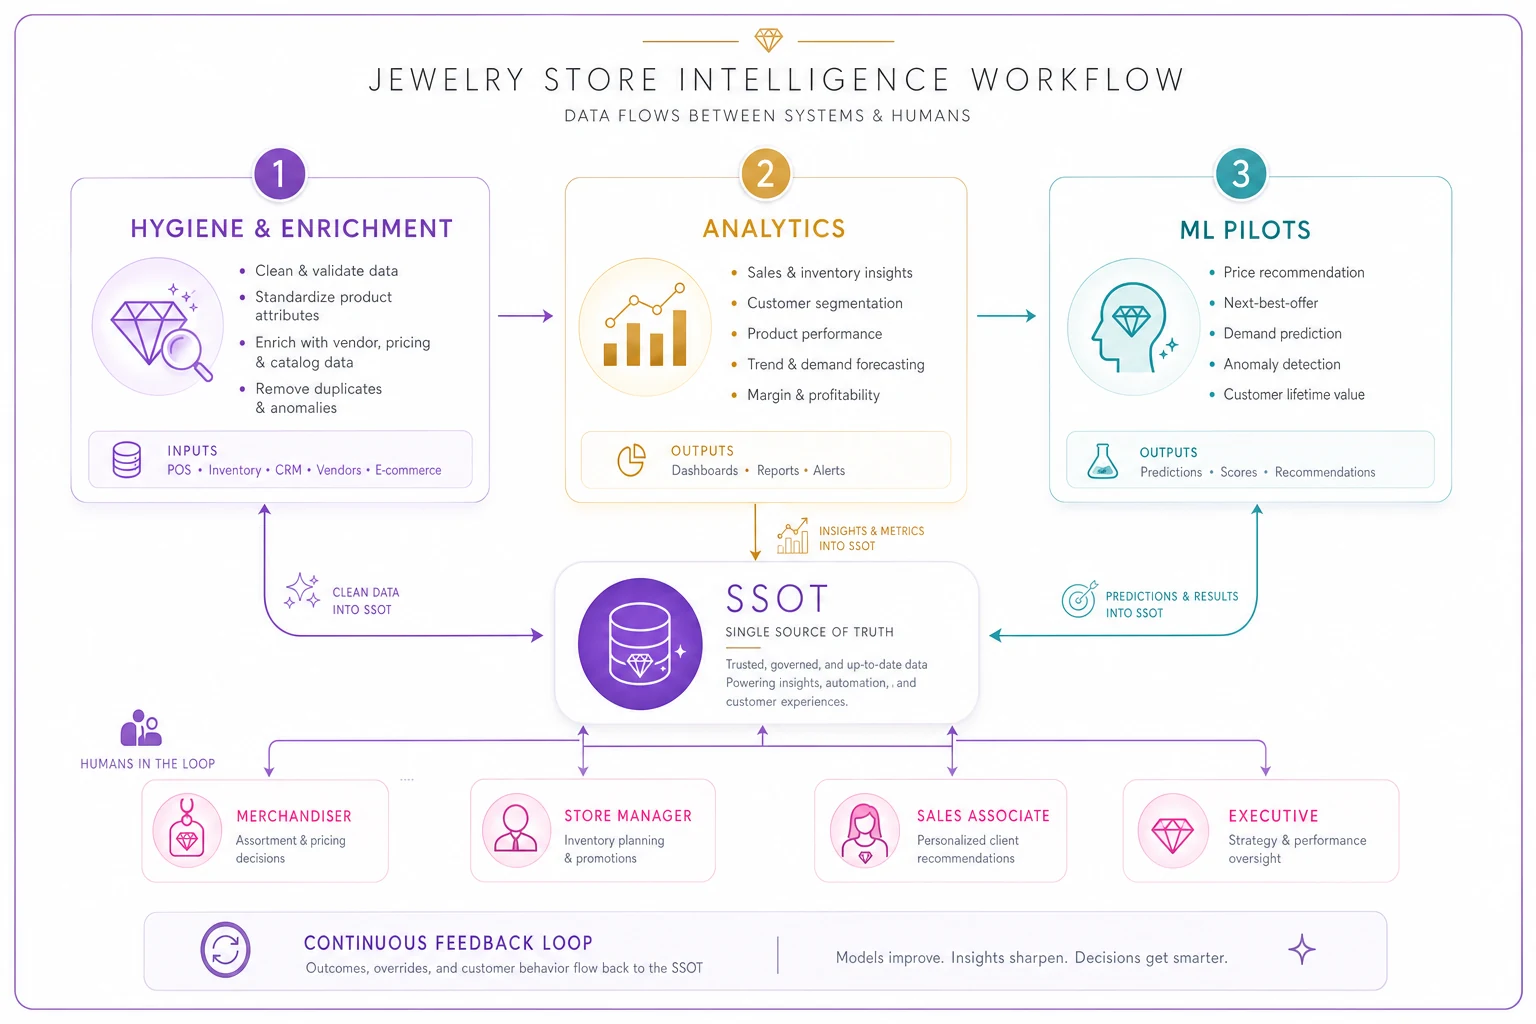
The whole point of staging is that each level feeds the next, and the outputs loop back.
Clean records (Stage 1) feed trustworthy analytics (Stage 2), which surface the categories and customer segments worth modeling (Stage 3), whose predictions flow back into reorder automation and daily selling — which generates new clean data that sharpens the next cycle. It's a loop, not a staircase you climb once.
A concrete picture of it running:
-
The SSOT holds one clean record per item and per customer.
-
Analytics flags that bridal turns well but you keep stocking out on a specific band width.
-
The predictive reorder pilot catches the stockout pattern and adjusts order timing around vendor lead times.
-
Appointment propensity scoring routes your strongest bridal prospects to prepared associates with the right inventory pulled in advance.
-
Those completed sales write clean outcome data back to the SSOT.
-
Next cycle, the models are sharper because the data is cleaner.
Below is a simple workflow showing how the stages feed each other.
Online, the same spine powers the signals that keep high-value shoppers from bouncing — consistent attributes and accurate availability are exactly what underpin trust signals for high-value jewelry buyers. A customer deciding whether to spend $6k online can feel the difference between a store whose data is coherent and one whose listings contradict each other.
A real scenario: the mid-size store that stopped guessing
Business type: A two-location jeweler, roughly $3M combined annual revenue, around 6,500 active SKUs.
The problem: They were carrying heavy fashion-gold inventory that wasn't moving while periodically stocking out on their best bridal sellers. Appointments were booked in one tool, sales recorded in the POS, repairs in a third system — none of them sharing a customer identity. Reports existed but contradicted each other, so the owner made ordering decisions mostly by feel.
What they did: Spent about four months on Stage 1 — deduplicating records, filling attribute gaps, and getting appointments, sales, and repairs tied to single customer profiles. Then ran Stage 2 analytics and discovered their fashion-gold category was turning around 1.1x while bridal was closer to 3.5x. They ran a shadow-mode predictive reorder pilot on bridal for six weeks before switching to assisted ordering.
Before vs. after (roughly, over about nine months):
| Metric | Before | After |
|---|---|---|
| Fashion-gold dead stock | Baseline | Down ~30% |
| Bridal stockout days | Frequent | Noticeably reduced |
| Overall inventory turns | ~1.9x | ~2.4x |
| Appointment-to-sale conversion | Unmeasured | Actively tracked and improving |
Nothing dramatic happened on day one. The gains showed up as the loop ran a few cycles — less cash tied in dead inventory, fewer missed bridal sales, and an owner who stopped lying awake wondering if the ordering was wrong. The models didn't replace anyone's judgment. They just made sure the judgment was pointed at the right problems.
Where stores get stuck (and how to tell which stage you're actually in)
A quick gut-check. Be honest about where you really are, not where you'd like to be:
-
You're in Stage 1 if your last count disagreed with the system, you have duplicate records, or appointments and sales can't be linked to one customer.
-
You're in Stage 2 if your data is trustworthy but you're still making ordering and assortment calls on instinct rather than turns-by-category.
-
You're ready for Stage 3 if your team already acts on analytics weekly, and you can define one narrow decision you want to automate and measure.
The most common stuck point is the Stage 1-to-2 handoff — stores clean their data once, declare victory, then let it rot because nobody owns maintenance. Data hygiene isn't a project. It's a habit. One person, clear standards, a few hours a week. Lose that and you'll be re-cleaning the same records in a year.
The second most common trap is buying predictive tooling to fix a hygiene problem. No model fixes bad inputs. It just hides them behind a confident number.
The bigger picture
A jewelry data maturity roadmap isn't really about technology. It's about sequencing — doing the boring foundational work so the sophisticated stuff actually functions, and resisting the urge to jump to the exciting part before you've earned it. The stores that get this right aren't the ones with the biggest software budgets. They're the ones who cleaned their data, learned to trust their numbers, and then automated a few decisions at a time.
Start where you actually are. If your records are messy, that's your whole job this quarter, and it'll pay for itself before you ever touch a predictive model. Clean data, honest analytics, narrow pilots — in that order. The turns, AOV, and LTV improvements follow naturally, because by then your systems are finally telling you the truth about your own business.
Start where you actually are. If your records are messy, that's your whole job this quarter, and it'll pay for itself before you ever touch a predictive model. Clean data, honest analytics, narrow pilots — in that order. The turns, AOV, and LTV improvements follow naturally, because by then your systems are finally telling you the truth about your own business.
Ready to elevate your jewelry store operations?
Join 500+ jewelers using Jewlyly to increase efficiency, reduce errors, and grow revenue.