



Most jewelry owners track turns the way they track the weather—glance at it, mutter something, and move on. The number sits in a quarterly report nobody acts on until a buying trip comes up or a vendor rep walks in with new samples. Meanwhile capital is frozen in a case that hasn't moved since two holidays ago, and nobody connects that frozen capital to the loan payment or the tight cash month in February.
The gap isn't that jewelers don't understand inventory turn. It's that turn gets treated as a merchandising stat instead of a financial control loop. A ring sitting for 400 days isn't just a slow mover—it's working capital you borrowed against, a carrying cost bleeding each month, and a balance-sheet asset that's probably overvalued because metal prices moved since you booked it. Turn is a money problem wearing a merchandising costume.
This article is about building the loop that ties SKU cohorts directly to profit and balance-sheet outcomes, so the monthly conversation between merchandising, procurement, finance, and pricing actually changes what you buy, what you hold, and what you repurpose.
Why turn optimization breaks in jewelry specifically
Jewelry inventory behaves differently from almost any other retail category, and the standard "turn = COGS / average inventory" formula hides more than it reveals.
A general retailer might turn inventory 6–8 times a year. A healthy jewelry store might turn 1.2 to 1.8 times, and that blended number is basically useless. Your fashion silver turns five or six times. Your loose diamond memo turns almost infinitely because you don't own it. Your estate case and high-end bridal might turn less than once a year. Average them together and you get a figure that tells you nothing about where your cash is stuck.
What breaks at scale is the blending. When you're a single store with a few hundred SKUs, you feel the slow movers—you walk past them. Add a second location, a consignment program, and an online catalog, and that feel disappears. Dead stock hides inside a blended turn number that looks "fine." Stores with a reported turn of 1.4 can easily be carrying 30–40% of their dollar value in items older than 18 months, and the owner has no idea because the aggregate masks it.
The second failure point is valuation drift. Jewelry is one of the few retail categories where the cost basis of your held inventory can move after you buy it, because metal and stone prices fluctuate. An item booked at a certain gold cost two years ago may still be carried at a value that no longer reflects reality. If you're not revaluing, your balance sheet is quietly lying to you—and your margin math on any eventual sale is wrong. If metal swings are already hammering your margins, the pricing side of this is worth a separate read on building a data-driven pricing system for jewelers.
Think in cohorts, not in SKUs or categories
The unit of analysis that actually works is the SKU cohort—a group of items that share a turn profile and a financial behavior, not just a product category.
Never miss a sale or shipment again.
Jewlyly helps you manage orders, track inventory, and engage customers seamlessly.
- Real-time inventory tracking
- Automated customer notifications
- Sales and order analytics
No credit card required
A category view ("rings," "necklaces," "watches") is too coarse. A SKU view is too granular to make decisions on. Cohorts sit in the middle: they group items by how they behave financially so you can apply one decision rule to the whole group.
A practical cohort structure for most stores looks like this:
| Cohort | Typical turn/yr | Avg days to sell | % of $ value (healthy) | Primary risk |
|---|---|---|---|---|
| Fast fashion / silver | 4–6 | 60–90 | 10–15% | Thin margin, theft shrink |
| Core bridal (stocked) | 1.5–2.5 | 150–240 | 25–30% | Overbuying sizes/styles |
| Memo / consignment | n/a (not owned) | varies | 0% owned | Reconciliation gaps |
| Fine / designer branded | 1–1.8 | 200–360 | 20–25% | Price-point sensitivity |
| Estate / pre-owned | 0.8–1.4 | 250–400 | 10–15% | Valuation drift, authentication |
| Aged / dead (18mo+) | <0.5 | 540+ | should be <10% | Frozen capital, write-down risk |
The "% of $ value" column is the one that matters most. The goal isn't to maximize turn on every cohort—nobody expects estate pieces to spin like silver. The goal is to keep each cohort inside a healthy band and catch the aged cohort before it balloons.
The insight most stores miss: your aged cohort is a leak, not a category. Items don't start there. They fall into it because no monthly decision gate caught them while they were still worth something.
The control loop: four gates, one monthly rhythm
A control loop is just a feedback system—measure, decide, act, measure again. For inventory turn, the loop runs monthly and pulls in four functions that normally never sit in the same conversation: merchandising, procurement, finance, and pricing.
-
Pull cohort snapshot (data prep). Before the meeting, generate turn, days-on-hand, and dollar concentration per cohort, plus an aging waterfall showing what crossed into the next age bucket this month. This is the most skipped step—people walk into the meeting arguing from memory instead of a shared snapshot.
-
Merchandising gate. For each cohort trending out of band, merchandising flags items for display repositioning, bundling, or feature. The question here is: can we sell this where it sits, with better presentation or placement?
-
Pricing gate. For aged items and metal-sensitive stock, pricing decides markdowns, revaluation, or hold. This is where you translate "it's old" into "here's the number that moves it without destroying margin."
-
Procurement gate. Open-to-buy gets adjusted based on what the cohort data shows. If core bridal is sitting at 280 days-on-hand, you don't reorder the same assortment—you reallocate that open-to-buy to whatever's turning faster. This is where good demand forecasting with seasonal models earns its keep.
-
Finance gate. Finance translates the decisions into cashflow and balance-sheet impact: how much capital gets freed, what the carrying-cost reduction looks like, what write-downs hit this period, and what any revaluation adjustment does to asset value.
-
Assign repurpose pathways. Anything that can't be sold as-is at an acceptable margin gets routed—trade-in credit, refurb, promo, scrap/melt, or transfer to a location where it actually sells.
Document owner and deadline for each gate decision in the control-loop artifact so items don't reappear unresolved.
The discipline is that every aged item leaves the meeting with a decision and an owner. No item gets "we'll look at it next month" twice. The second time something shows up unresolved, it auto-escalates to a repurpose pathway.
Here's a quick visual to keep the monthly rhythm consistent.
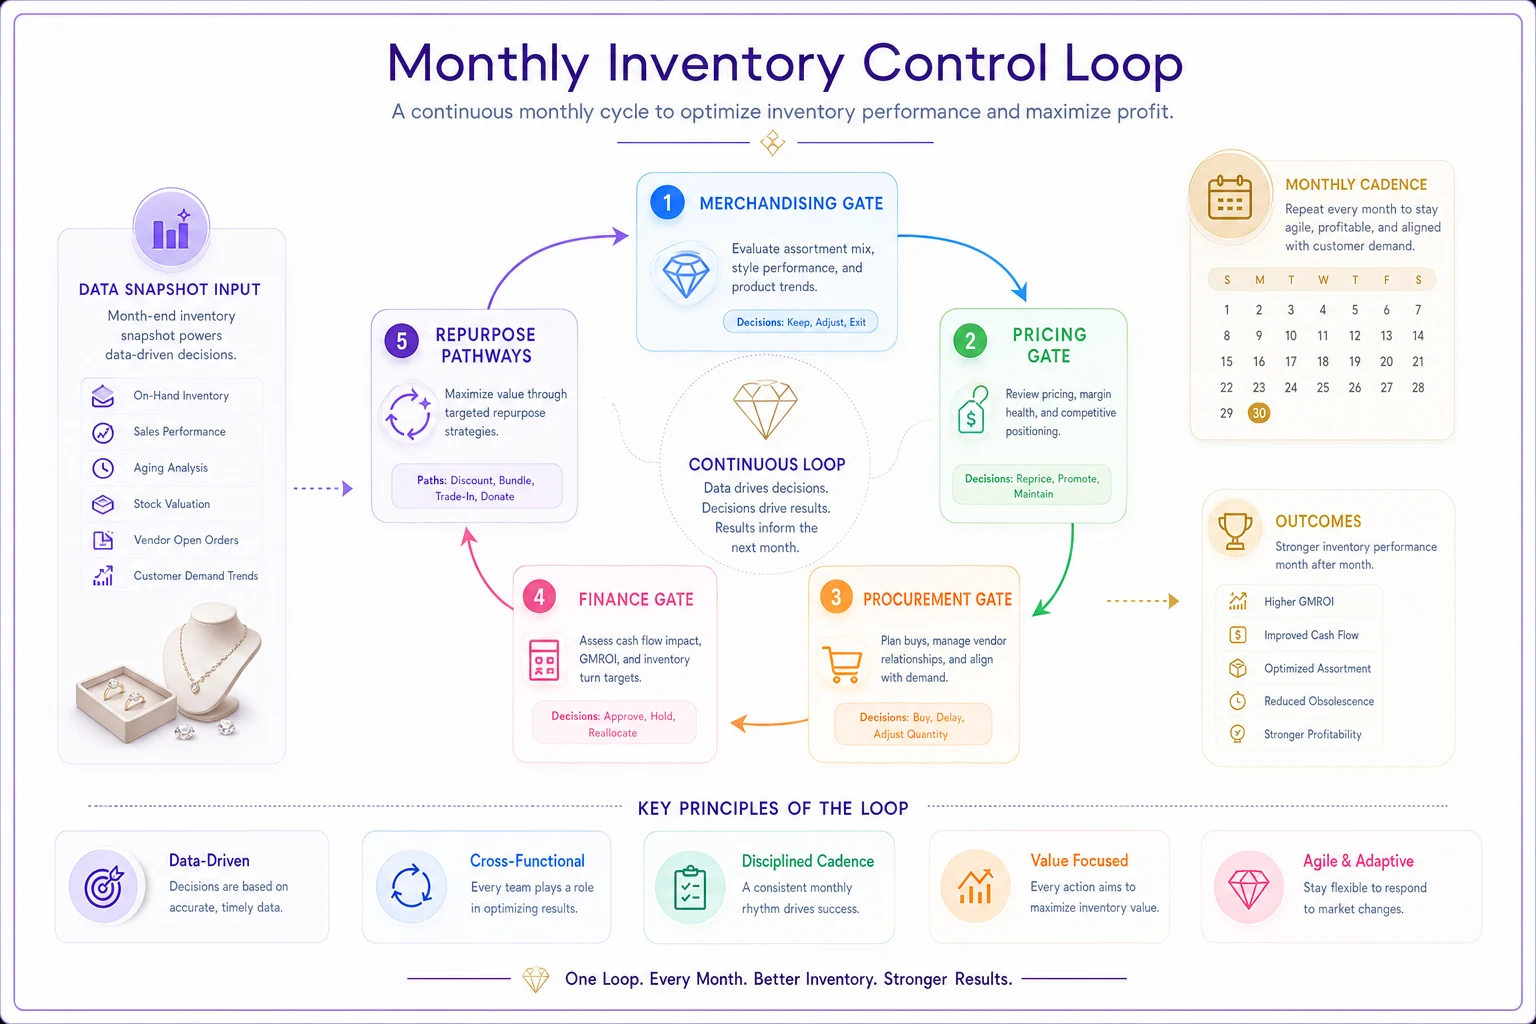
The loop's discipline is simple: measure cohorts, pick actions, assign owners, and track cash impact—repeat monthly.
KPI definitions that actually connect to money
Turn alone won't drive the loop. You need a small set of KPIs that each cohort gets measured against, and each one needs a financial translation.
-
GMROI (Gross Margin Return on Inventory Investment) gross margin dollars ÷ average inventory cost. This is the real scoreboard. A cohort can have a slow turn but high GMROI if margins are fat—estate and designer pieces often look like this. Don't penalize a cohort for slow turn if its GMROI is strong.
-
Days-on-hand by cohort average inventory cost ÷ daily COGS, per cohort. Your early-warning gauge for capital getting stuck.
-
Aging concentration % of dollar value in each age bucket (0–6mo, 6–12, 12–18, 18+). The 18+ bucket is your write-down radar.
-
Sell-through rate units sold ÷ units received, per buy cycle. Tells procurement whether the last buy was right-sized.
-
Carrying cost per cohort financing rate + insurance + shrink allowance applied to average inventory value. Usually 1.5–2.5% per month in this category once you honestly load in insurance and cost of capital.
-
Frozen capital dollar value of the 18+ cohort. This is the number finance cares about because it's cash you could redeploy.
The mistake stores make is tracking turn and stopping there. Turn is a ratio; cash is a dollar amount. The owner needs the dollar translation to feel the urgency. "Our aged cohort turn is 0.4" produces a shrug. "We have roughly $180k frozen in items older than 18 months, costing us about $3,200 a month to hold, and the gold in them is worth less than what we booked" produces a decision.
A worked cohort example
Take a two-location store carrying roughly $2.1M in inventory at cost. Finance pulls the monthly snapshot and the core bridal cohort looks off.
-
Core bridal cohort value
~$590k
-
Days-on-hand
310 (band target: 180–240)
-
GMROI
1.6 (acceptable, but trending down)
-
Aging
about $140k of it has crossed into the 12–18 month bucket
The old habit would be to leave it alone—bridal "always sells eventually." The loop forces a different read. That $140k aging slice is concentrated in three ring styles and a cluster of odd finger sizes that were overbought the prior year. At a monthly carrying cost of roughly 2%, that slice alone is bleeding close to $2,800 a month.
-
Merchandising pull the three slow styles into a "bridal refresh" feature case and the online bridal landing block.
-
Pricing odd sizes get a targeted promo rather than a blanket markdown—resizing cost built into the offer.
-
Procurement open-to-buy for the next bridal cycle cut by the value of what's aging; reallocated toward the fine/designer cohort, which is turning at 1.9 with a GMROI of 2.4.
-
Finance models that moving the aging slice over two quarters frees roughly $110k–$130k in capital and trims about $2,500/month in carrying cost.
None of this is dramatic. A few targeted actions and a reallocated buy. But run this loop for twelve months across every cohort and the compounding is the whole game—capital that would've frozen gets caught early and redeployed into stock that actually moves.
Repurpose pathways: where turn becomes cash
When an item fails the sell-as-is test, it needs a defined exit. Guessing at exits per-item is where margin disappears. Build the pathways once, then route cohorts through them by rule.
-
Trade-in / upgrade credit. Offer aging core stock as upgrade targets for existing customers. Moves inventory and strengthens the relationship instead of eating a straight markdown.
-
Refurb and re-list. Estate and pre-owned that's gone stale often just needs re-polishing, re-photographing, or re-certification to reset its clock as "new" to the market.
-
Promo / bundle. Fast and silver cohorts that stall respond to bundling far better than to markdowns.
-
Scrap / melt. For damaged or genuinely dead stock, melt value at current metal prices is sometimes the honest floor—and it's real cash, immediately. The balance-sheet revaluation you've been avoiding gets forced here, which is healthy.
-
Inter-location transfer. The same ring that's dead at one location sells at another. This only works if your counts are clean—worth tightening your inventory lifecycle and miscount controls before you lean on transfers.
Decision rules for routing
-
Age 12–18mo and GMROI above target → merchandising/pricing action, hold in sell channel.
-
Age 18mo+ and GMROI acceptable → promo or trade-in pathway.
-
Age 18mo+ and GMROI below target → refurb if margin is recoverable, otherwise transfer or melt.
-
Metal content value exceeds carried book value → revalue and consider melt floor.
-
Flagged unresolved two consecutive months → auto-route to a repurpose pathway, no further debate.
Routing decisions stop being contentious when the rules exist in advance. Without them, every aged item becomes a debate about sentimental attachment to the buy, and the meeting runs long while the carrying cost keeps ticking.
A sample monthly control-loop template
Keep the artifact simple enough that people actually fill it in. One row per cohort:
| Field | What it captures |
|---|---|
| Cohort | Which group |
| Value at cost | Current $ held |
| Days-on-hand | vs. target band |
| GMROI | vs. target |
| $ aged into next bucket | This month's leak |
| Decision | Hold / markdown / promo / trade-in / refurb / transfer / melt |
| Owner | Who executes |
| Cashflow impact | $ freed + carrying-cost change |
| Review date | When to re-check |
The "cashflow impact" column is what makes this a financial loop instead of a merchandising report. Every decision gets a dollar consequence attached before anyone leaves the room.
When this system makes sense—and when it doesn't
When it's worth building: You're carrying more than roughly $750k–$1M in inventory, you have more than one channel or location, and cash feels tight even when sales look fine. That "tight cash, fine sales" feeling is almost always frozen inventory, and this loop is built to find it.
When it's overkill: A single small store with a few hundred SKUs and an owner who physically touches every piece weekly probably doesn't need formal cohort gates yet. The feel still works at that size. Don't bureaucratize what you can see with your own eyes.
Who should not do this: If your counts aren't clean—if your POS quantity-on-hand doesn't match the case—don't build a financial control loop on top of bad data. You'll make confident decisions off fiction. Fix counting and reconciliation first, then build the loop. Cohort analysis on dirty inventory is worse than no analysis, because it feels rigorous while being wrong.
A short real scenario
A regional jeweler with three locations sat at a blended turn of 1.3 and kept hitting cash crunches every first quarter despite a strong holiday run. The owner assumed the problem was seasonality and kept using a line of credit to bridge February and March.
When inventory got broken into cohorts, the actual problem showed up fast: around 28% of dollar value was sitting in the 18-month-plus bucket, most of it in two categories that had been overbought during a good year and never corrected. Carrying cost on that frozen slice was running somewhere around $9k–$11k a month once insurance and financing were honestly loaded in.
They ran the monthly loop for three quarters. Aged stock got routed—trade-in offers to existing bridal customers, a refurb push on the estate case, melt on a batch of genuinely dead pieces where metal value exceeded book. No dramatic moves. By the third quarter the aged bucket was down to roughly 14%, they'd freed somewhere north of $200k in capital, and the Q1 credit-line draw shrank to almost nothing. Blended turn only moved to about 1.6—modest on paper—but the cashflow change was the whole point.
Bringing the functions into one view
The hardest part of this isn't the math. It's getting merchandising, procurement, finance, and pricing to look at the same cohort snapshot on the same cadence and actually decide something. In most stores those four functions live in four heads and three spreadsheets, and the aged cohort grows in the gaps between them.
This is where a workflow platform that centralizes POS data, inventory aging, and cost tracking earns its place—not because software is magic, but because the loop dies the moment someone has to manually assemble the snapshot every month. When cohort aging, GMROI, and carrying-cost calculations refresh automatically and flag items crossing age thresholds, the monthly meeting becomes a decision session instead of a data-wrangling session. The automation isn't the strategy. It just removes the friction that makes stores quietly abandon the loop by month three.
The point of tying SKU cohorts to your P&L and balance sheet isn't to turn inventory faster for its own sake. Fast turn on the wrong cohort just means churning low-margin stock while real capital sits frozen somewhere else. The point is to make the money visible—to see which cases are assets and which are quietly borrowed cash you're paying to store. Once every cohort has a band, every aged item has a pathway, and every decision has a dollar attached, turn stops being a stat you glance at and becomes the lever that actually controls your cash.
Once every cohort has a band, every aged item has a pathway, and every decision has a dollar attached, turn stops being a stat you glance at and becomes the lever that actually controls your cash.
Ready to elevate your jewelry store operations?
Join 500+ jewelers using Jewlyly to increase efficiency, reduce errors, and grow revenue.