

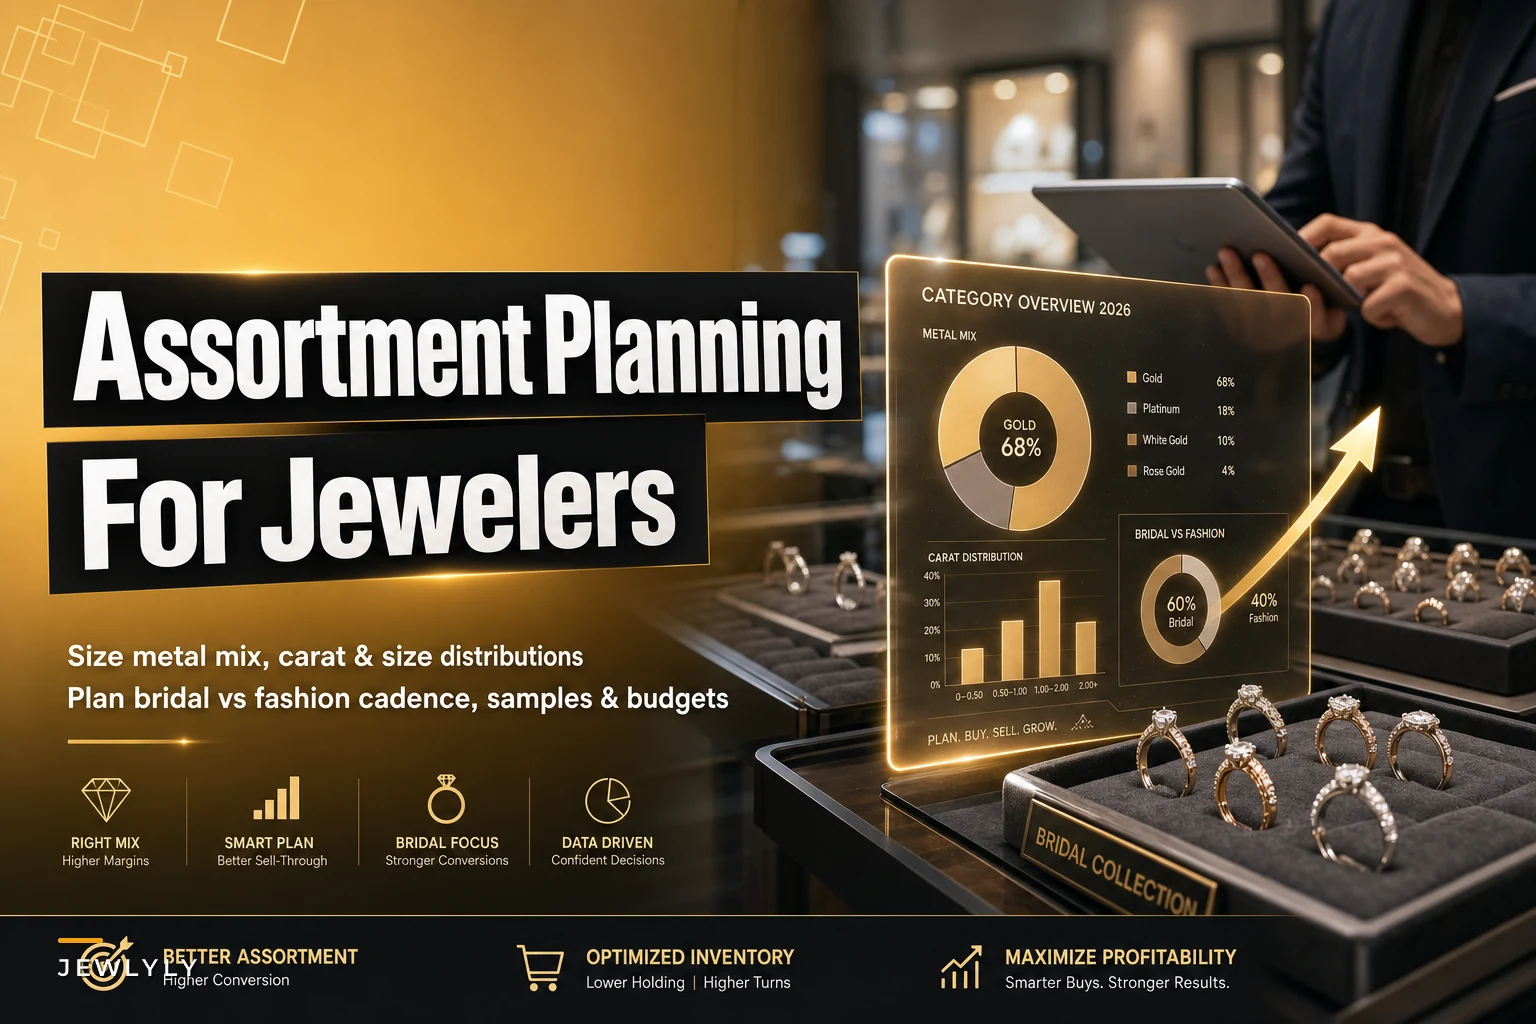

Most jewelry stores carry around 40% of their inventory in pieces that move less than once a year. Not because of bad initial buying decisions, but because their assortment planning never evolved past "buy what looks good" or "replace what sold." Without a structured framework for metal mix, size distributions, and category cadence, you're essentially gambling with $200k+ in inventory investment.
The difference between profitable jewelers and those constantly stressed about cash flow usually comes down to one thing: how well their assortment matches actual local demand. Not what sells nationally, not what vendors push at market, but what your specific market actually buys.
Why traditional jewelry buying creates inventory dead zones
Walk into most independent jewelry stores and you'll find the same pattern. The bridal case has eight platinum settings when 85% of local engagement purchases are white gold. Fashion jewelry sits heavy in 18k when the market prefers 14k at that price point. Size 7 rings dominate the cases when local demographics actually skew toward size 6 and 8.
This happens because jewelry buying has always leaned on vendor relationships and visual merchandising instincts rather than structured data. Vendors show beautiful pieces, buyers select what catches their eye, and inventory slowly drifts away from what actually sells.
The financial impact compounds fast. A 60-piece assortment with poor category alignment can mean roughly $75,000 sitting in cases generating zero turns. That same capital, properly allocated based on local patterns, could realistically generate significantly more in annual revenue.
Jewelry is also just harder to plan than most retail categories because of extreme variation in price points, materials, and purchase motivations. A $300 silver fashion piece and a $30,000 diamond solitaire both count as "one unit" in basic inventory systems, but they require completely different planning approaches.
Metal mix allocation based on price band performance
Your metal distribution should reflect purchase patterns at each price point — not aesthetic preferences or vendor suggestions. Here's what typically works across different markets:
Never miss a sale or shipment again.
Jewlyly helps you manage orders, track inventory, and engage customers seamlessly.
- Real-time inventory tracking
- Automated customer notifications
- Sales and order analytics
No credit card required
Under $1,000 price band:
-
Sterling silver
35-40%
-
10k gold
25-30%
-
14k gold
30-35%
-
Alternative metals
5-10%
$1,000-$3,000 price band:
-
14k gold
60-65%
-
18k gold
20-25%
-
Two-tone combinations
10-15%
-
Platinum
0-5%
$3,000-$10,000 price band:
-
14k gold
40-45%
-
18k gold
35-40%
-
Platinum
15-20%
Above $10,000:
-
18k gold
45-50%
-
Platinum
35-40%
-
Custom/special orders
10-15%
These are starting points, though. A store near a university will skew heavily toward lower bands with more silver. A boutique in an affluent suburb might see real platinum demand even in the $2,000 range.
Track your actual sales for 90 days, categorizing each piece by metal and price band. Most stores discover they're overweighted in their aspirational price points and underweighted where actual volume happens — and the patterns that surface are usually surprising.
Size distribution framework that reduces special orders
Standard size runs from vendors rarely match local demographics. The typical vendor distribution centers on size 7 for rings, but actual demand curves vary quite a bit by market.
Instead of accepting whatever size run the vendor defaults to, build your own distribution model:
Ring size allocation (typical starting framework):
| Size | Standard Vendor % | Adjusted for Young Demographics | Adjusted for Mature Demographics |
|---|---|---|---|
| 4-5 | 10% | 8% | 15% |
| 5.5-6 | 15% | 12% | 20% |
| 6.5-7 | 35% | 25% | 30% |
| 7.5-8 | 25% | 30% | 20% |
| 8.5-9 | 10% | 20% | 10% |
| 9.5+ | 5% | 5% | 5% |
Log both sold and tried-on ring sizes during your tracking period to capture true demand.
For bracelets, the 7-inch standard works for maybe 40% of customers. Yet most stores stock 80% at that length, creating constant special order delays and frustrated customers.
Track every sizing request for 60 days — both sales and special orders. You'll identify your actual demand curve, which typically shows two peaks rather than one clean bell curve. Usually one around size 6 and another around size 8, with less demand at the traditional size 7 center than vendors assume.
Bridal vs fashion cadence planning
Bridal and fashion jewelry operate on completely different cycles, yet most stores plan them together. Bridal buying needs to happen 3-4 months before peak seasons. Fashion buying is more like 6-8 weeks out.
Bridal inventory cadence:
-
January-February
30% of annual bridal budget (Valentine's and early spring proposals)
-
April-May
25% (graduation and summer proposals)
-
September-October
35% (holiday proposals)
-
November-December
10% (mostly fulfillment, not new inventory)
Fashion jewelry follows different patterns:
-
February-March
20% (spring refresh)
-
April-May
30% (Mother's Day and graduation)
-
September-October
25% (fall/holiday early birds)
-
November
25% (holiday season)
The mistake happens when stores treat all jewelry the same — loading up on fashion pieces in October when they should be focusing on bridal for holiday proposals, or investing heavily in bridal inventory in November when that selling window has largely closed.
Separate your open-to-buy into distinct bridal and fashion budgets. A typical split runs 60/40 bridal to fashion for established stores, but newer stores building their fashion clientele might run closer to 70/30 initially.
Sample allocation strategy for testing new categories
Testing new categories or vendors without overcommitting inventory requires some structure. Most stores either go too light — one or two pieces that prove nothing — or too heavy, tying up capital in a full collection that takes months to evaluate.
The minimum viable test for a new category needs:
-
6-8 pieces across price points
-
3-4 pieces at your volume price point
-
2-3 pieces at aspirational price points
-
1-2 entry-level pieces
For a new colored gemstone line, that might look like:
-
Two $400-600 pendants (entry)
-
Three $800-1,200 rings (volume)
-
Two $1,500-2,000 statement pieces (aspirational)
-
One $2,500+ showpiece (halo effect)
Track performance for 45 days. If the volume price point shows movement, expand that section first. If nothing moves in 45 days during a reasonable selling season, exit the category rather than hoping it turns around.
Buy-budget templates that prevent inventory bloat
A working buy-budget prevents the gradual inventory creep that quietly kills cash flow. Start with your annual sales target and work backward:
Annual planning framework:
-
Total sales target
$1,200,000
-
Target turn rate
2.5x
-
Required average inventory
$480,000
-
Seasonal peak allowance (20%)
$576,000
-
Maximum inventory position
$576,000
Category allocation:
-
Bridal
50% = $288,000
-
Fashion gold
25% = $144,000
-
Fashion silver
15% = $86,400
-
Watches/other
10% = $57,600
Monthly buying power calculation:
Month starting inventory + Month purchases - Month projected sales = Month ending inventory
Never let ending inventory exceed your maximum position. If December ending inventory projects at $620,000, reduce November-December purchases by $44,000.
This keeps inventory aligned with sales rather than growing independently. Stores that maintain strong turns follow their buy-budget consistently. Those struggling at 1.5x turns typically abandon it after a few months when buying pressure from a vendor feels more urgent than the spreadsheet.
Local demand intelligence gathering
National trends tell you almost nothing useful about your specific market. That rose gold wave might already be fading in your area while white gold stays strong. Here's how to actually capture local intelligence:
Transaction pattern analysis:
-
Review 6 months of sales data, categorizing by
-
- Metal type and color
-
- Stone type and size
-
- Price point clusters
-
- Day of week patterns
-
- Customer age ranges
Special order tracking:
-
Every special order represents unmet demand. Track
-
- What was requested
-
- Why you didn't have it
-
- How often similar requests come up
-
- Whether it makes sense to stock it
Repair and custom work signals:
Repair tickets reveal what people actually own and wear. If 70% of repair work involves white gold despite your cases being 50% yellow gold, that's a real disconnect worth addressing.
Competition shopping patterns:
Visit competitors quarterly, noting:
-
Their metal mix
-
Price point emphasis
-
What appears picked over (high demand)
-
What looks stale (low demand)
Use these signals together — transaction patterns, special orders, repair tickets, and competitor visits — to build a coherent picture of local demand.
The technology layer that makes this manageable
Manual assortment planning in spreadsheets starts breaking down around 300 SKUs. Formulas drift, updates lag, and by the time you're making a buying decision the data is already two weeks old.
More jewelry operations are moving to AI-powered platforms that continuously analyze sales patterns, flag seasonal demand shifts, and suggest reorder points before you're already out of stock. These systems track customer interactions beyond just completed sales — what people looked at, what they asked about, what they walked away from — building a demand picture that raw transaction data alone tends to miss. When three customers ask about rose gold bands in a week, a good platform surfaces that signal before it becomes a missed opportunity.
Here's how that workflow typically looks in one platform.
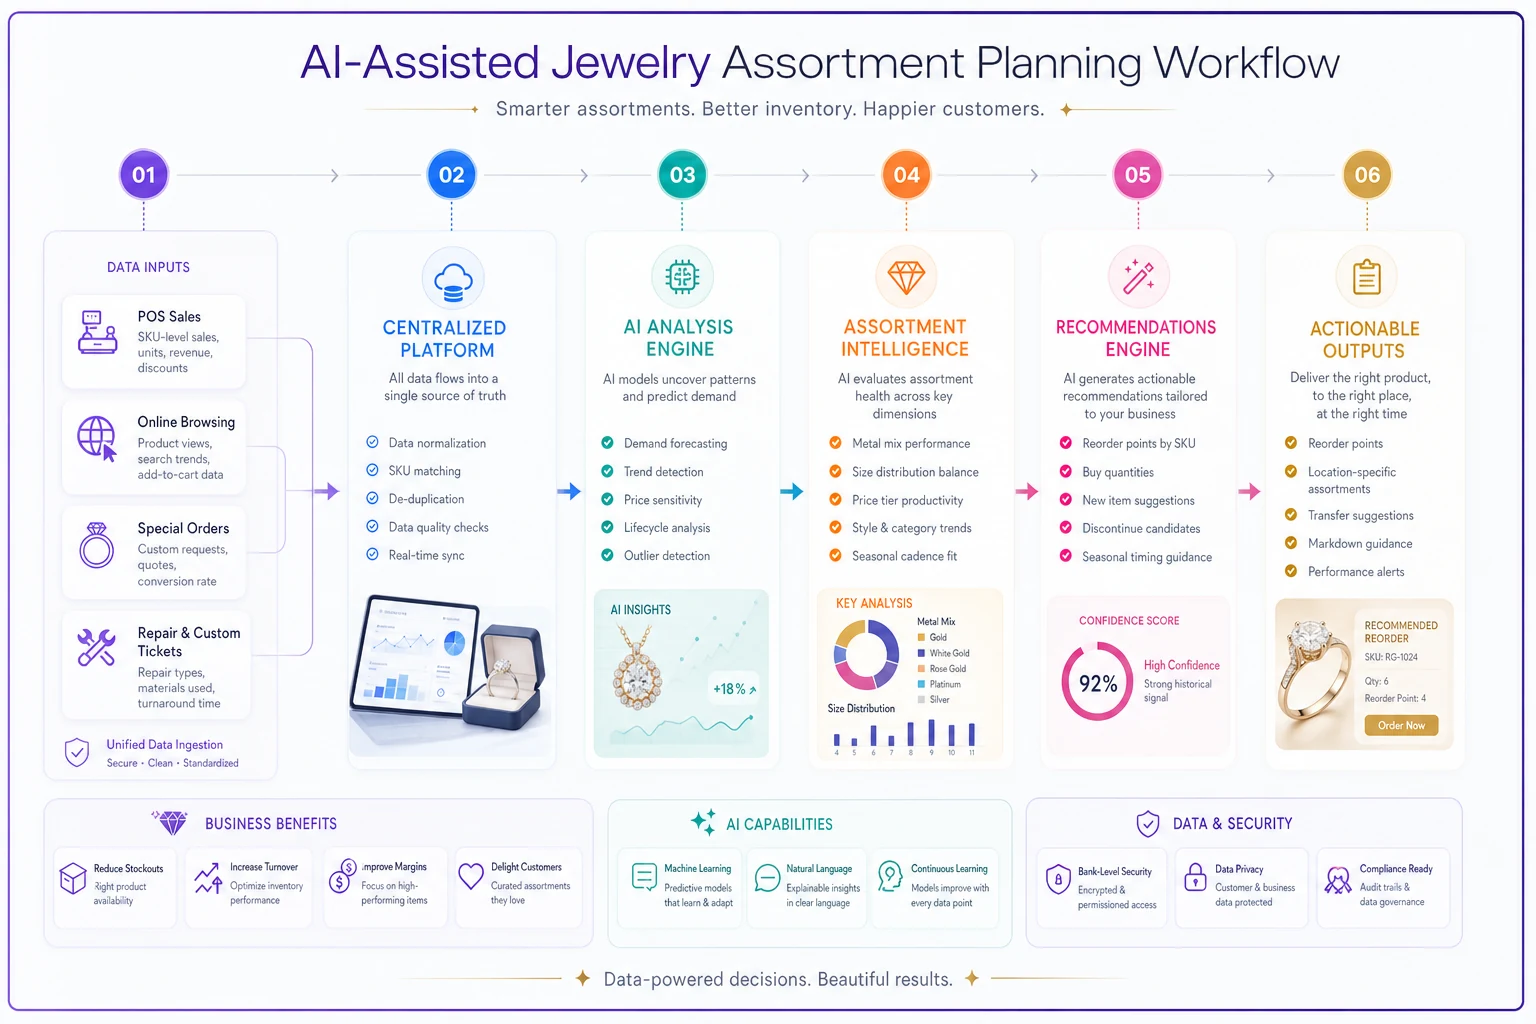
Start centralizing data once you approach 300 SKUs to avoid spreadsheet drift.
The bigger operational win is centralization. Instead of juggling vendor catalogs, sales reports, and inventory sheets across different tools, everything flows through one platform that actually understands jewelry-specific nuances like metal market shifts, stone availability cycles, and seasonal demand patterns.
For multi-location jewelers, this kind of AI-assisted workflow becomes especially useful for maintaining consistent assortment strategies while still allowing local variations. The system might recommend 40% white gold across all locations but adjust suburban stores to 45% and downtown locations to 35% based on actual purchase patterns at each site. That level of precision is genuinely hard to maintain manually across more than two or three locations.
Making the framework work in practice
Starting tomorrow, implement these specific changes:
-
Categorize your current inventory by metal, price band, and category. This gives you a baseline reality check.
-
Track for 30 days Every sale, special order, and customer request. Don't change anything yet — just gather data.
-
Calculate your gaps Compare actual sales distribution to current inventory distribution. You'll find three to five major misalignments pretty quickly.
-
Adjust new purchases first Don't liquidate existing inventory. Shift new buying toward identified gaps.
-
Set monthly reviews Assortment planning isn't a one-time exercise. Markets shift, demographics change, trends come and go.
Stores seeing consistent growth aren't necessarily buying better jewelry — they're buying the right jewelry for their specific market. They know their metal mix, they understand which sizes actually sell versus sit, and they plan bridal and fashion on separate cycles that match real buying patterns.
More importantly, they treat assortment planning as an operational discipline, not a seasonal chore. Every buying decision fits within a framework built on local data, not vendor suggestions or what looked good at market.
Better assortment planning typically improves inventory turns by 0.5-1.0x within the first year. On $500,000 in inventory, that's a meaningful difference in annual sales from the same capital investment.
The question isn't whether you need an assortment framework — it's how much you're leaving on the table without one while competitors quietly optimize their mix and capture more of your market.
Ready to elevate your jewelry store operations?
Join 500+ jewelers using Jewlyly to increase efficiency, reduce errors, and grow revenue.